

Tracing
Track and analyze LLM calls and execution processes to monitor performance and quality.
Overview
The Tracing page allows you to view all LLM calls and execution processes automatically collected through the SDK. Each trace includes information such as input, output, latency, token usage, and cost. You can filter or search traces to quickly find the data you need, and convert selected traces into datasets or add them to Annotation queues.
Viewing Traces
You can view basic information for each trace in the trace list and analyze the complete execution process on the detail page.
Trace List

The trace list table displays the following information:
Timestamp: When the trace was created
Name: Trace name
Input: Input data (summary view)
Output: Output data (summary view)
Latency: Response time (seconds)
Tokens: Input/output token counts
Cost: Estimated cost
Risk Score: Risk score
Status: Success / error / pending status
This list can be adjusted using the Table Header button.
Clicking a trace row navigates to the detail page where you can view all information.
Trace Detail
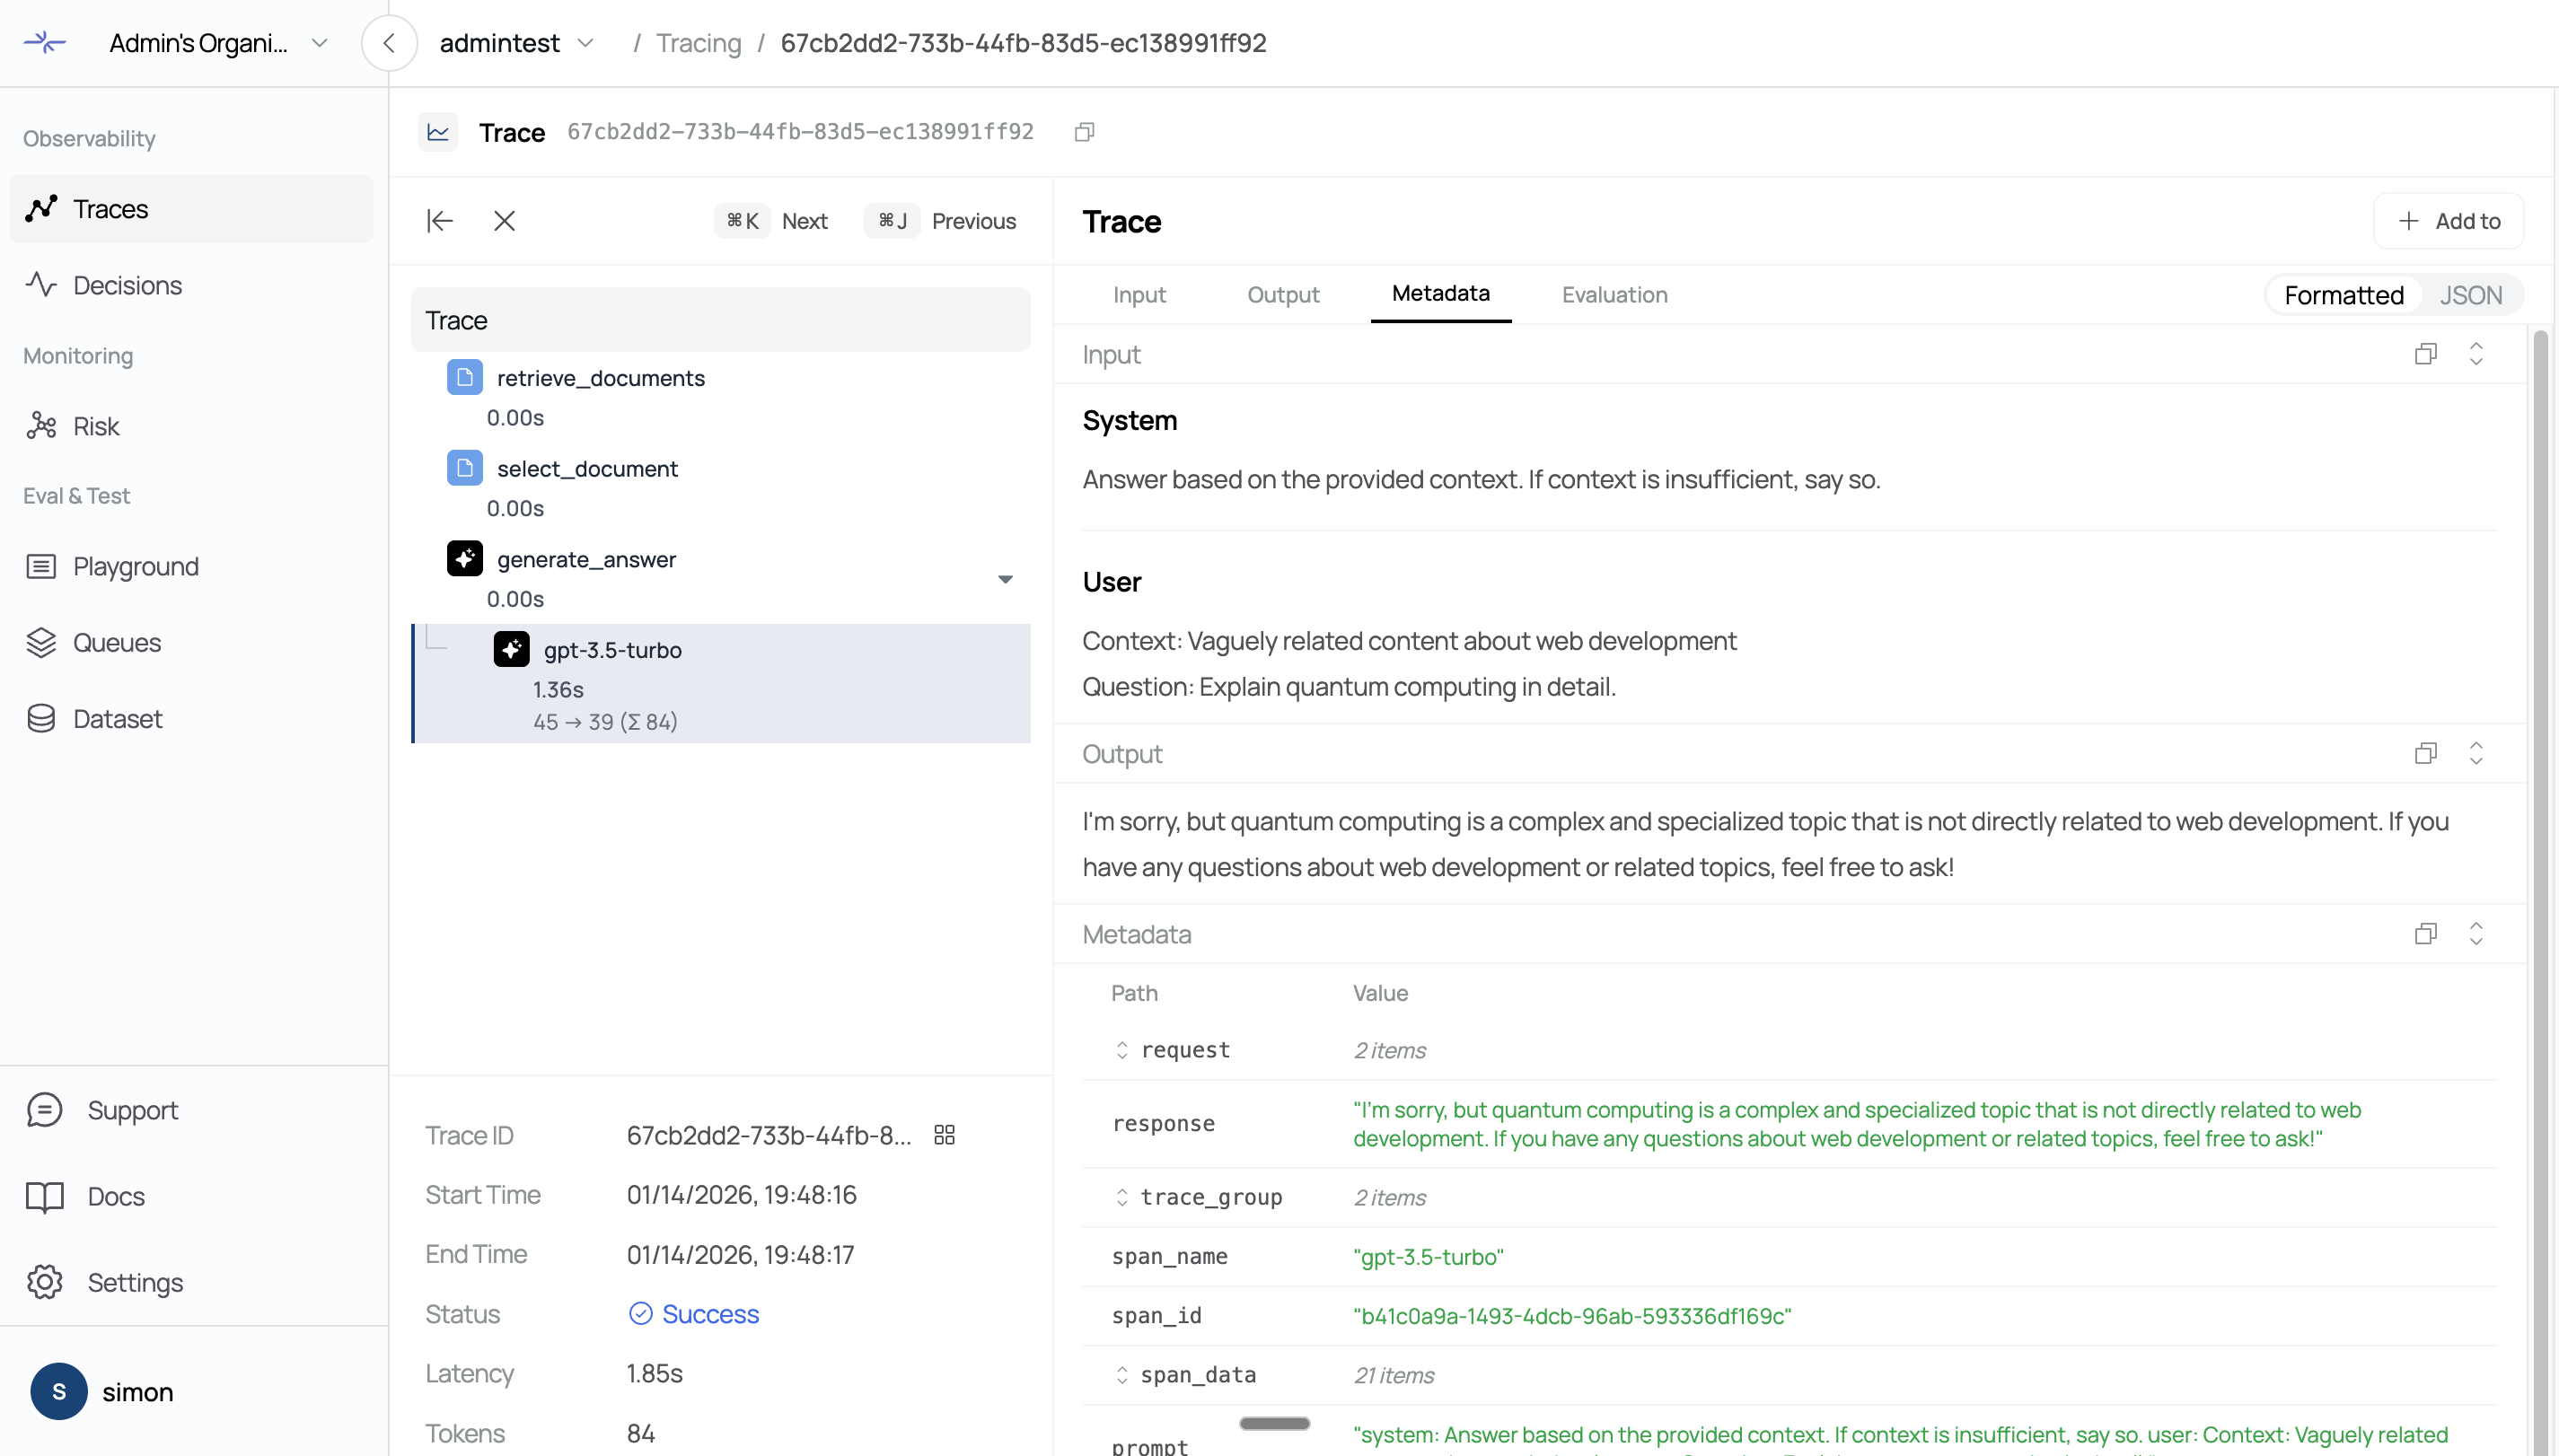
On the trace detail page, you can view the following information:
Complete input and output data
Hierarchical structure of the execution process (Observations)
Latency and token usage for each step
Metadata and error information
System prompt and user query
Assistant response
Observations represent each execution step within a trace and are displayed in a nested structure.
Filtering
You can filter traces by various conditions to view only the data you need.
Time Range
Select a time range from the top header to view only recent traces:
1h: Past 1 hour
6h: Past 6 hours
1d: Past 1 day
3d: Past 3 days
7d: Past 7 days
14d: Past 14 days
You can also use the calendar to specify a custom date range.
Advanced Filters
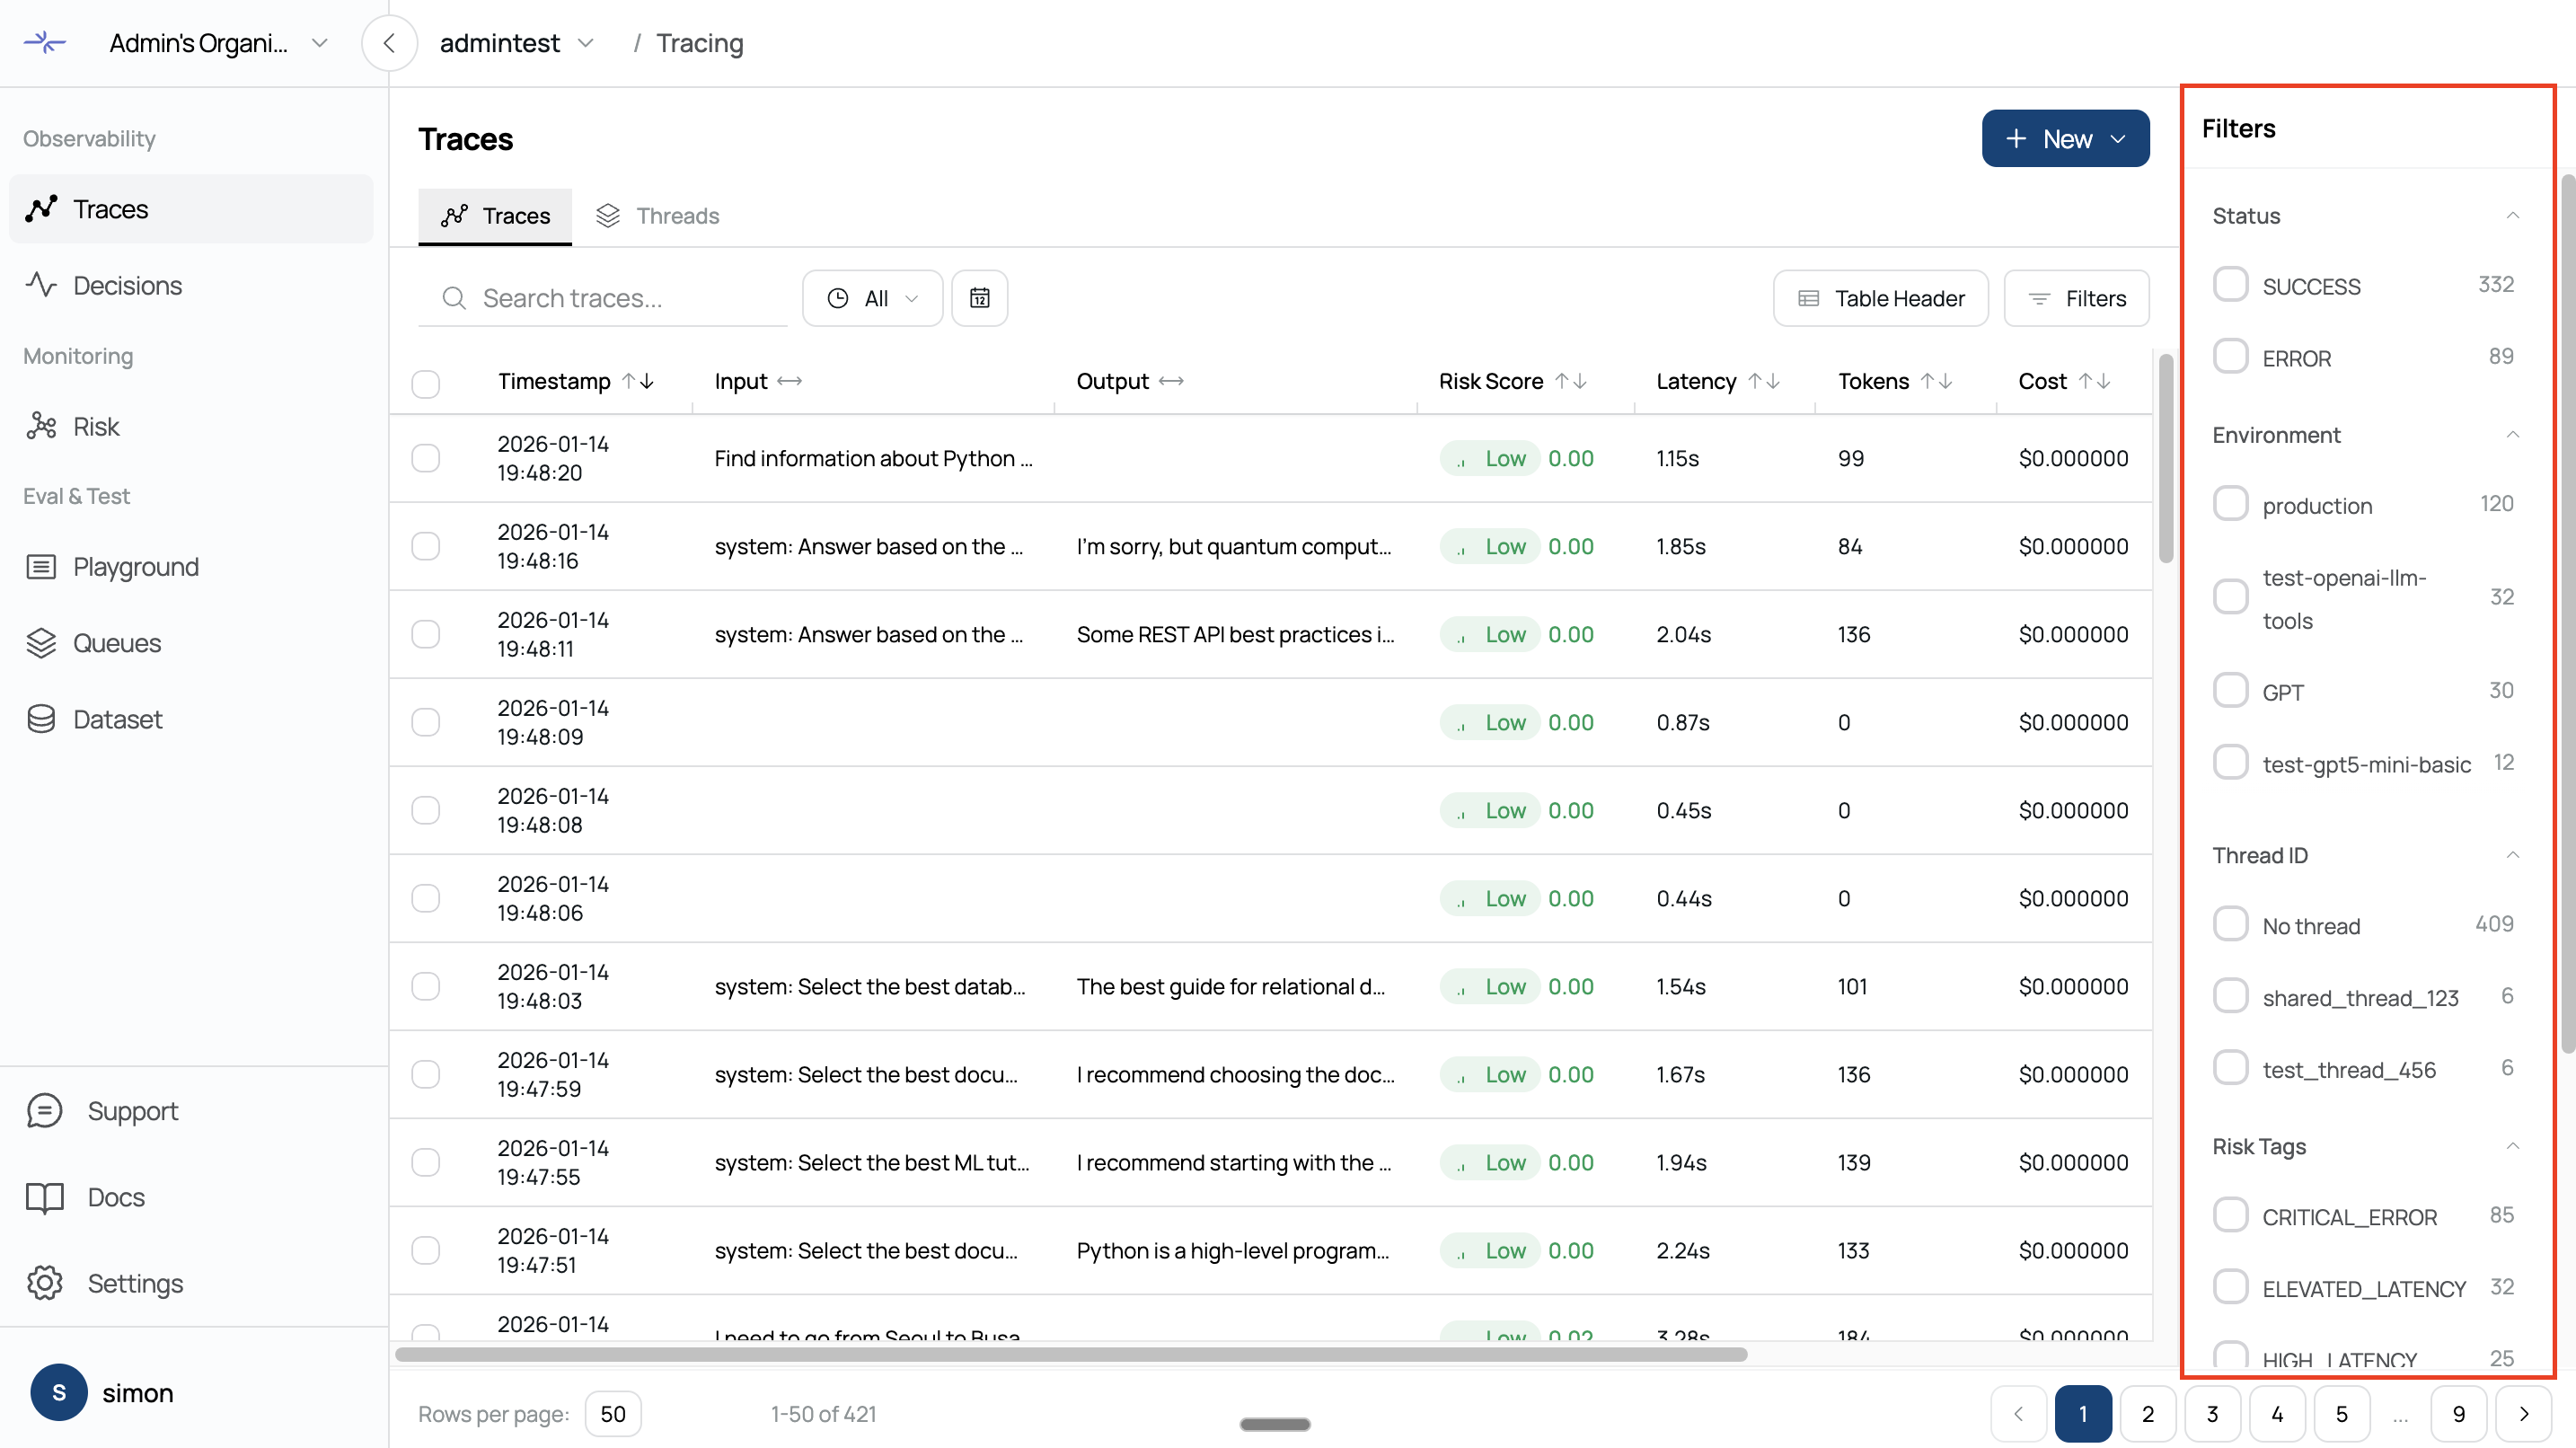
More detailed filtering is available in the filter panel on the left sidebar.
Status
Filter by success, error, or pending statusEnvironment
Filter by environment (production, development, etc.)Thread ID
View traces from a specific sessionUser ID
View traces from a specific userLatency
Filter by response time range (using a slider)Input Tokens
Filter by input token count rangeOutput Tokens
Filter by output token count rangeCost
Filter by cost rangeRisk Tag
Filter traces by risk tag
The filter panel can be opened and closed by clicking the filter icon in the header.
Search
You can search by trace name in the top search bar. Entering a search term filters results in real time.
Selecting Traces
You can select multiple traces to perform batch operations.
Select individual traces using the checkbox in each row
Select all traces using the checkbox in the table header
The number of selected traces is displayed in the header
Creating Dataset from Traces
You can convert selected traces into a dataset.
Select Traces
Select the traces you want to add to the dataset using checkboxes.Click Create Dataset
Click New - Create Dataset in the top header.Configure Dataset
Create a new dataset or select an existing one.
For a new dataset, enter a name and description.Complete Creation
Click the Create button to add the selected traces as dataset items and navigate to the dataset detail page.
Created datasets can be viewed and managed on the Datasets page.
Creating Annotation Queue from Traces
You can add selected traces to a Annotation queue for evaluation.
Select Traces
Select the traces you want to add to the queue using checkboxes.Click Create Annotation Queue
Click New - Create Annotation Queue in the top header.Enter Queue Information
Enter a queue name (required) and description.
The queue name should clearly indicate the evaluation purpose
(e.g., Hallucination Check).Select Score Configs (Optional)
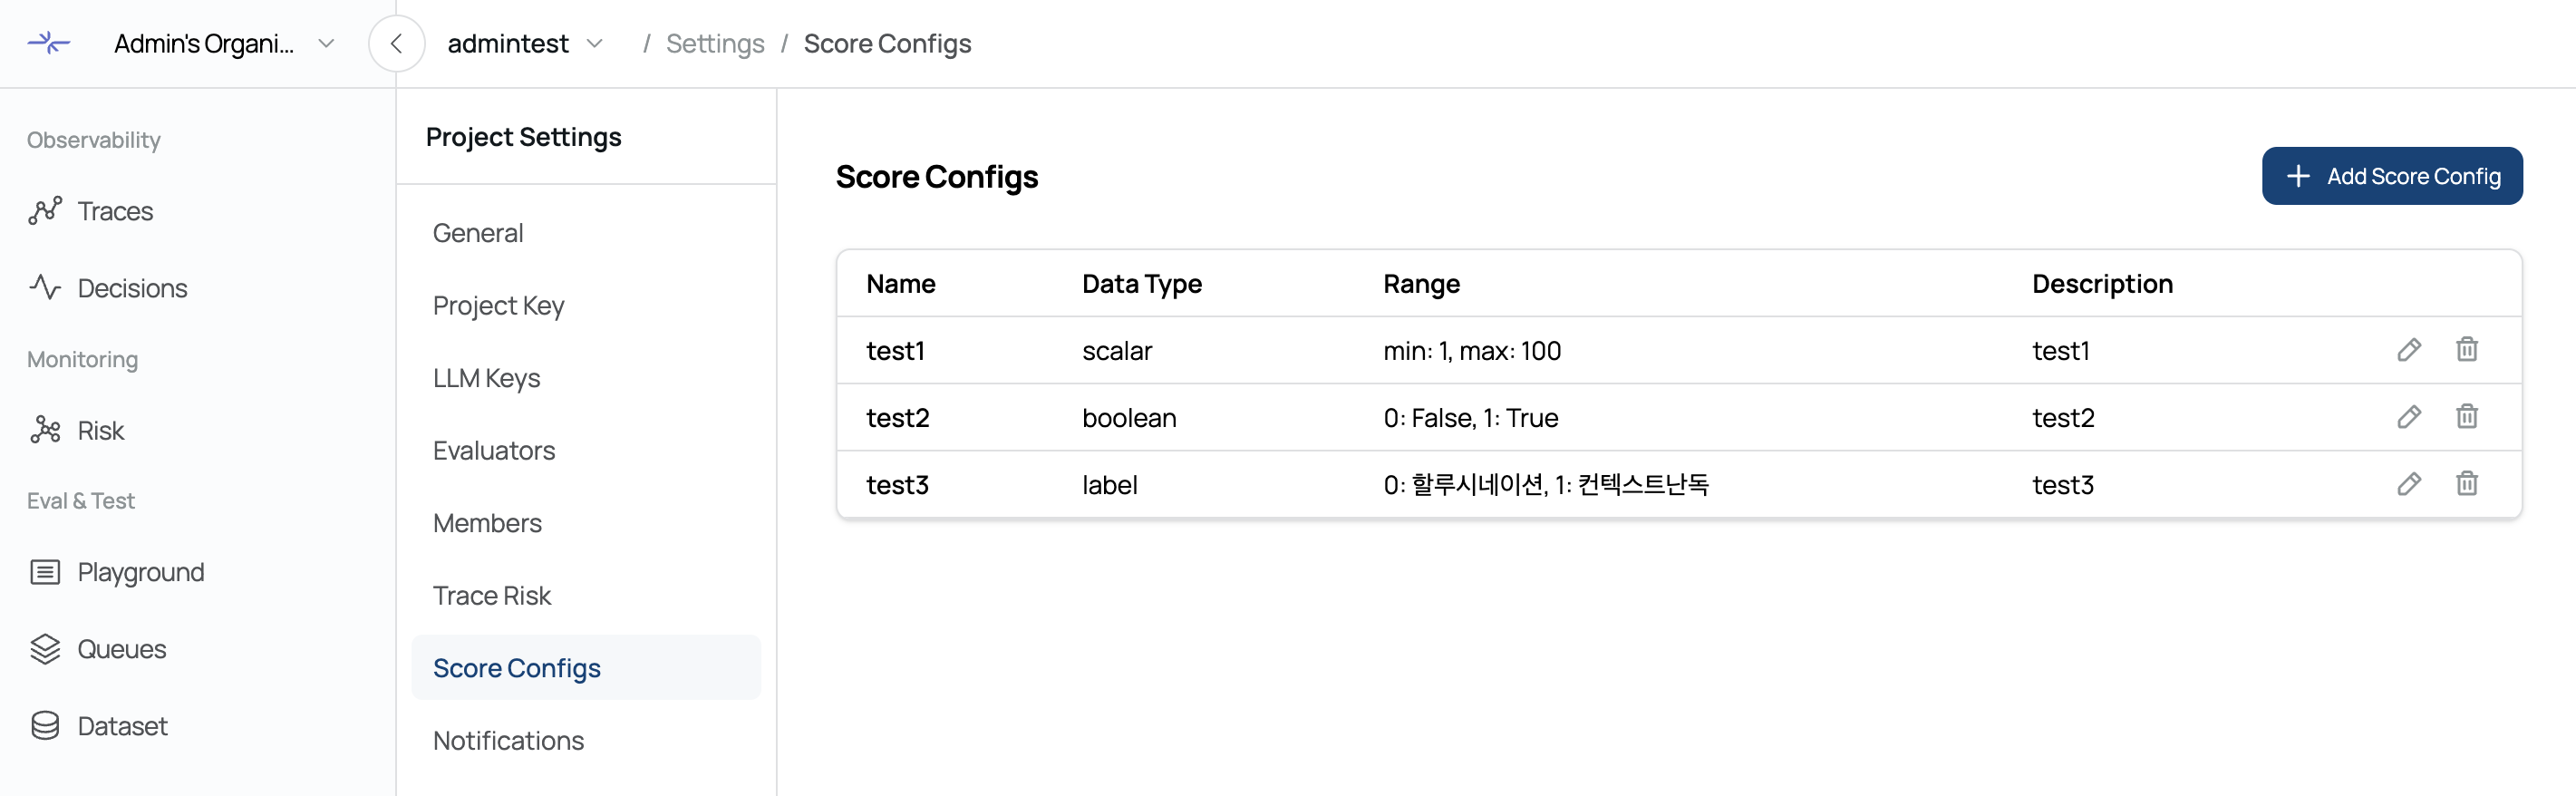
Select Score Configs to use for evaluation.
You can select multiple, and this step is optional.
Score Configs can be created and modified in the Score Configs tab of the project settings page.Complete Creation
Click the Create button to add the selected traces as queue items and navigate to the Annotation page.
Created queues can be viewed and managed on the Annotation page.
Traces in the queue can be evaluated one by one using the Process Queue feature.
Sorting and Pagination
Features to efficiently navigate the trace list.
Click the Timestamp column header to sort by time (ascending/descending)
Navigate pages using the pagination controls at the bottom
Adjust page size to change the number of traces displayed at onc
Was this page helpful?